Onboarding
Use this to onboard one or more platforms. Currently we support:
- Azure DevOps
Onboard Azure DevOps Organisations
Bring Azure DevOps organisations under management by scanning them through your pipeline and then uploading the results in your browser.
Curious about how it feels but don't really want to install an extension?
Head over to app.observes.io, download the sample scan results and have a play
Observes Playground
Pre-Requisites
You'll be able to perform a full scan of the Azure DevOps organisation or select target projects. However, the scan is limited to the access granted to the user identity performing the scan.
- User or service account with read access to the targeted Azure DevOps projects (service connections, variable groups, secure files, repositories, pools, repositories)
- Read-only PAT token (linked to the account that performs the scan) on Agent Pools, Analytics, Build,Code,Graph,Project and Team,Secure Files,Service Connections,Task Groups and Variable Groups
- Ability to run the scanner: You can run the observes-scanner locally with a PAT or through a pipeline. We give you two example pipelines, one using the extension (recommended) and the other using the standalone observes scanner (if the extension is not available).
If you want to install the extension in your ADO organisation you may require approvals for this - Help me explain this extension
Note: If you want to see environments, your PAT must also have Environment (Read & Manage) We only require Read, but this is as much least privilege as it currently gets :(
Guide: Onboarding Observes Scanner + UI
There are two ways to implement Observes for your ADO organisations:
- Extension (recommended): Installing the extension makes available the scanner and the UI from the ADO interface
- Standalone (locally or in the pipeline): Run the standalone scanner and upload the results into the Observes app in app.observes.io
Guide 1: Leverage the Observes Extension
Installing the Observes extension will make available in your organisation the following resources:
- Service Connection type: Create a service connection of type Observes
- Pipeline Task: Directly use the pre-configured pipeline task in your pipeline
- Hub component: Upload the scan results here
To onboard:
-
Create a Service Connection of Observes Azure DevOps Scanner
my-observes-service-connectionwith the appropriate PATService connection creation
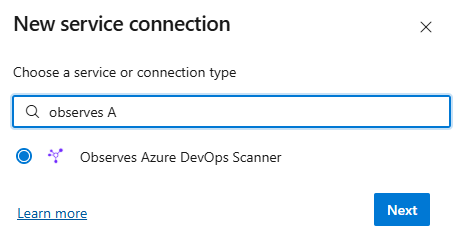
Create Service Connection
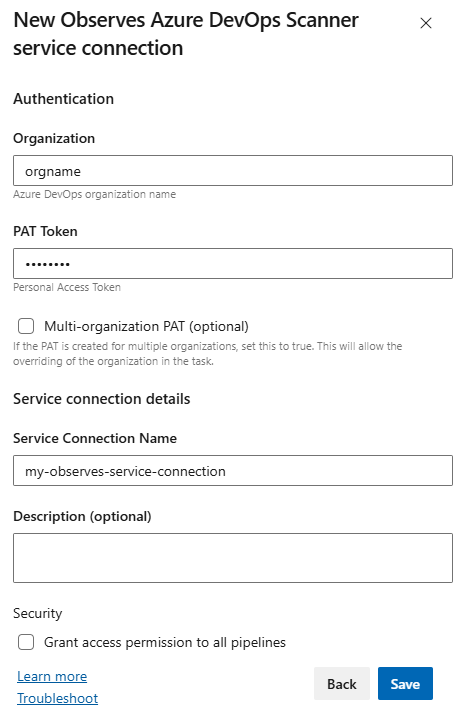
Create Service Connection - Details
-
Configure and run the pipeline by downloading the example YAML file:
Download runme-extension.yml
Use the created service connection in your pipeline configuration. Results will be available in the artifacts of the pipeline run. -
Navigate to the Azure DevOps hub component (Azure DevOps interface -> Select any project -> Side bar Observes)
https://dev.azure.com/ORG/PROJECT/_apps/hub/Observesio.observes.observes-huband upload the scan results
Observes ADO hub component
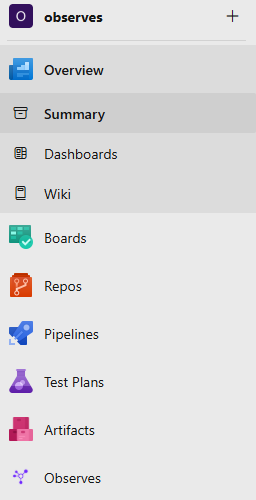
Observes ADO Hub Component
Guide 2: Run Standalone
If the extension is not an option for you at the moment, running the scanner locally and leveraging the app hosted in app.observes.io is an alternative.
- Scan your ADO organisation either by installing the observes-scanner locally or by configuring and running the pipeline using the provided example YAML file:
Download runme-standalone.yml
Use the appropriate credentials for your scan. - Navigate to app.observes.io and upload the scan results there
Curious about how it feels but don't really want to install an extension nor run the scanner against your organisation? Head over to app.observes.io, download the sample scan results and have a play.
Project Structure
azuredevops.py: Core logic for Azure DevOps API integration and enrichmentscan.py: Orchestration and entry point for scanning operationsrequirements.txt,Pipfile: Python dependenciesrunme-standalone.yml: Example pipeline to run the standalone scannerrunme-extension.yml: Example pipeline to run the scanner with the extension installed
Install
- Download the appropriate executable for your platform from GitHub Releases, or install the extension from the Azure DevOps Marketplace.
- If running from source:
pwsh
  git clone https://github.com/observes-io/observes-scanner.git
  cd observes-scanner
  pip install -r requirements.txt
Authentication
The Azure DevOps Personal Access Token (PAT) can be provided in two ways:
- As a CLI argument:
-p <pat-token>or--pat-token <pat-token> - As an environment variable:
AZURE_DEVOPS_PAT
If both are provided, the CLI argument takes precedence. If neither is provided, the tool will exit with an error.
CLI Usage
All configuration and options must be provided as CLI arguments. The following options are available:
-o, --organization           Azure DevOps organization name (required)
-j, --job-id                 Job ID for this scan (required)
-p, --pat-token              Azure DevOps Personal Access Token (optional if AZURE_DEVOPS_PAT is set)
-r, --results-dir            Directory to save scan results (default: current working directory)
    --projects               Optional comma separated list of project names or IDs to filter scan
-rb, --top-branches-to-scan  Number of default plus top branches to scan for each repository
                             -1 for all branches, 0 for default branch only, >= X for default and X top branches (default: 5)
    --skip-committer-stats   Skip committer stats calculation for faster scans
    --skip-feeds             Skip artifact feeds scanning for faster scans
    --skip-builds            Skip build and build pipeline data collection (only resources and permissions)
    --resolve-identities     Enable identity resolution for service connections, variable groups, and secure files
                             (requires laughing-lamp package)
Example usage:
./observes-scanner.exe -o <organization> -j <job-id> -p <pat-token> [-r <results-dir>] [--projects <project1,project2>] [--top-branches-to-scan 10] [--skip-feeds] [--skip-committer-stats]
Or, if running from source:
python scan.py -o <organization> -j <job-id> -p <pat-token> [-r <results-dir>] [--projects <project1,project2>] [--top-branches-to-scan 10] [--skip-feeds] [--skip-committer-stats]
Alternatively, you can set the PAT as an environment variable:
$env:AZURE_DEVOPS_PAT="your-pat-token"
python scan.py -o <organization> -j <job-id>
The tool queries Azure DevOps and returns results as a JSON file. All sensitive data (tokens, secrets) should be stored securely and never hardcoded.
Required PAT Permissions
The Azure DevOps Personal Access Token (PAT) should have the following permissions:
- Agent Pools (Read): Access build agent pool data for pipeline and resource inventory.
- Analytics (Read): Retrieve language metrics and analytics data for projects and repositories.
- Build (Read): Query build definitions, pipeline runs, build results, and dry runs (preview yaml).
- Code (Read): Access repositories, commits, branches, pull requests, and committer information.
- Graph (Read): Access users, groups, and service principals for identity and permissions mapping.
- Project and Team (Read): List and query projects, teams, and related metadata.
- Secure Files (Read): Access secure files used in pipelines and releases. We are unable to read the contents.
- Service Connections (Read): List and query service endpoints and connections for deployments.
- Task Groups (Read): Access shared task groups used in build and release pipelines.
- Variable Groups (Read): Access shared variable groups for pipeline configuration. We are unable to read the value of secure variables.
- Environment (Read & Manage): Required only if you need to view environment data. We only require Read access, but this permission level is the least privilege currently available.
You can run the scanner without all these permissions for limited results (i.e.: if access to service connections is not granted, information about service connections will be limited).
Navigating Results
When you have at least one integration, the menu items will appear:
- Overview
- Resource Tracker
- Platform Management
Not sure what to look for? Use the base policy conditions from the built-in filters
- Is a resource protected by access conditions? Resource protected?
- Is a resource accessible by the expected pipelines? Resource overshared?
- Is a resource accessing the expected Logic Containers? Resource overprivileged?
- Is a resource cross-project? Does the resource exist in more than one project? Shared across projects?
- Is a pipeline accessing resources? Permissioned pipeline?
- Is a pipeline permissioned into resources from different Logic Containers? Pipeline overpermissioned?
Filters for base policy set
Overview
The Overview page provides a high-level summary of onboarded platforms:
- Onboarded projects information
- Number of Pipeline Definitions and Pipeline Executions
- Number of CI/CD Resources (repositories, service connections, variable groups, secure files, pools)
- Language Breakdown of the project's repositories
Resource Tracker
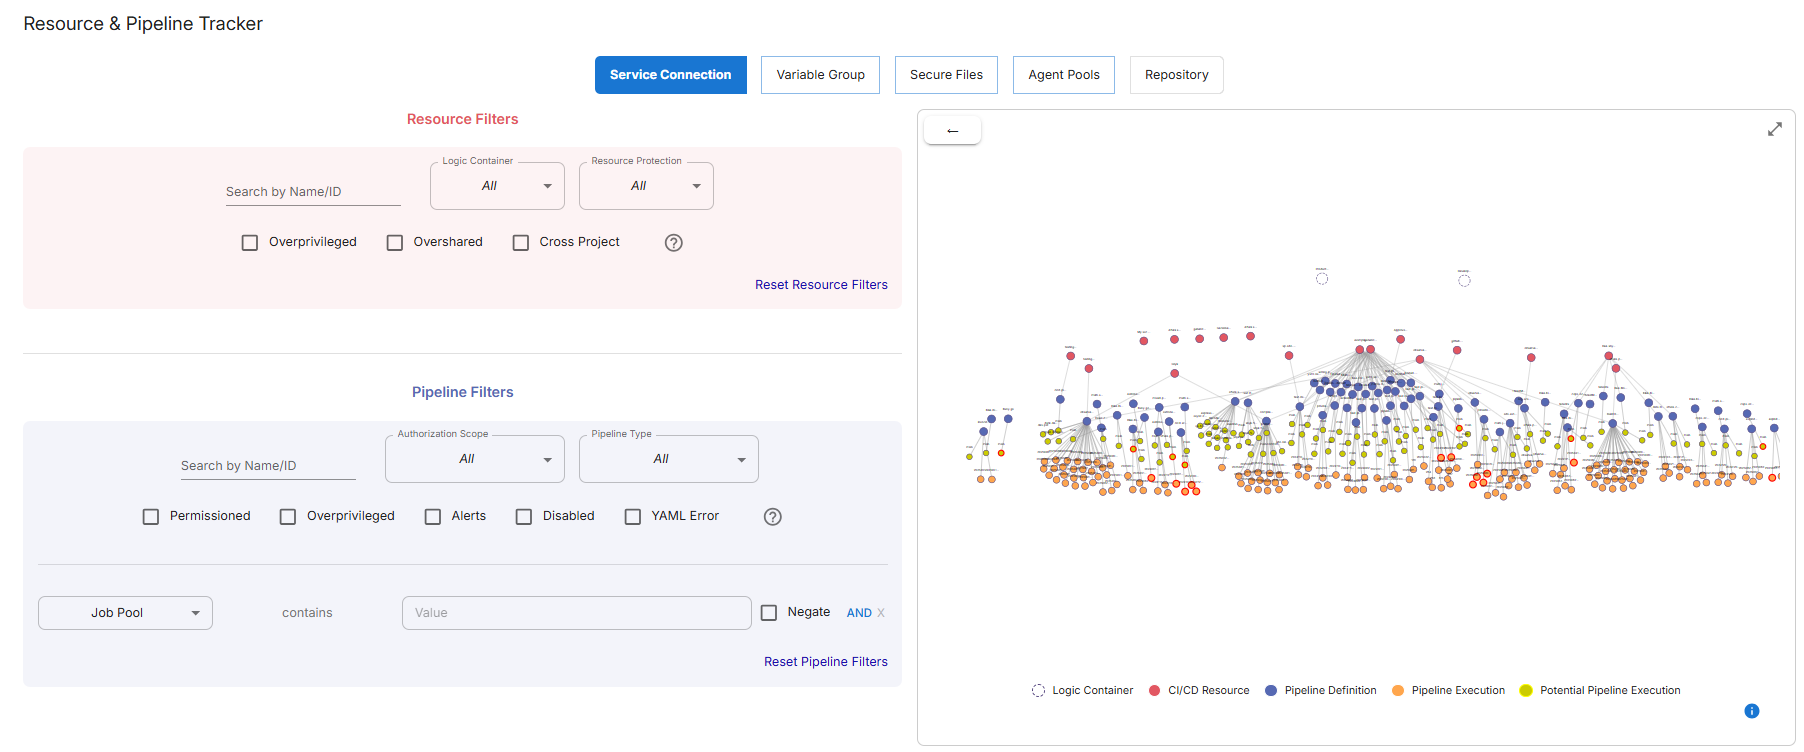
The Resource Tracker combines CI/CD Resources and Pipelines across the onboarded platforms. It allows you to visualise, filter and find relationships between your resources and pipelines - within the selected scope (organisation-wide or project-specific).
This screen will highlight action tracks. Find out what to do with Fast Track Adoption.
What Am I Seeing?
The visualisation depicts:
- White Nodes: Logic Containers
- Red Nodes: Discovered CI/CD resources (allocating them to Logic Containers enables filtering based on their criticality)
- Blue Nodes: Pipeline Definitions which may be permissioned to access CI/CD Resources (i.e.: service credential, variable groups, secure files, build agents)
- Yellow Nodes: Potential Pipeline Executions represent pipeline configurations imminent to concretise into an execution. The number of nodes usually corresponds to the number of branches the repository holding the pipeline configuration has.
- Orange Nodes: Pipeline Executions represent instantiations of the pipeline.
Filters are available for both CI/CD Resource attributes and Pipeline attributes.
Resource & Pipeline Tracker
Platform Management
The Platform Management view is where most of the management takes place. Use the guidance in Fast Track Adoption to accommodate use cases:
- Overprivileged Pipelines
- Overprivileged Resources
- Overshared Resources
- Resource-based Policy
- Pipeline-based Policy
Settings
The Settings page lets you customize global configurations, such as the navbar location (it's a big deal!).