Onboarding
Use this to onboard one or more platforms. Currently we support:
- Azure DevOps
Onboard Azure DevOps Organisations
Bring Azure DevOps organizations under management by scanning them through your pipeline and then uploading the results in your browser.
Curious about how it feels but don't really want to install an extension?
Head over to app.observes.io, download the sample scan results and have a play
Observes Playground
Pre-Requisites
You'll be able to perform a full scan of the Azure DevOps organization or select target projects. The scan is limited to the access granted to the user identity performing the scan.
- User or service account with read access to the targeted Azure DevOps projects (service connections, variable groups, secure files, repositories, pools, PAT tokens)
- (If using PAT auth) A read-only PAT token with scopes: Agent Pools, Analytics, Build, Code, Graph, Project and Team, Secure Files, Service Connections, Task Groups, and Variable Groups. Optionally add Environment (Read & Manage) and Token Administrator (Read & Revoke).
- Ability to run the scanner - either locally or in a pipeline. See the guides below.
Approvals may be required to install the Azure DevOps extension - Help explaining the Observes extension.
Note: All PAT token scopes are optional - the scan will collect whatever data is accessible. We only require Read, but this is as much least privilege as it currently gets.
Guide: Onboarding Observes Scanner + UI
There are two ways to implement Observes for your ADO organizations:
- Extension (recommended): Installing the extension makes the scanner and UI available directly from the ADO interface.
- Standalone (locally or in a pipeline): Run the standalone scanner and upload the results into the Observes app at app.observes.io.
Guide 1: Leverage the Observes Extension
Installing the Observes extension adds the following to your ADO organization:
- Observes service connection type - A new service connection type purpose-built for the Observes scanner, supporting PAT, service principal, and certificate-based authentication
- observes@1 pipeline task - A pre-configured task that handles scanner download, authentication, and execution, ready to drop into any pipeline
- Observes hub component - A new entry in your ADO sidebar where you can upload and explore scan results without leaving Azure DevOps
Step 1: Choose and configure an authentication method
The observes@1 task supports two service connection types. See Authentication for full setup instructions for each.
Option A - Observes service connection (authMethod: observes)
Create a dedicated Observes service connection under Project Settings > Service connections > New service connection > Observes Azure DevOps Scanner. Supports:
- PAT token
- Service principal with client secret
- Service principal with certificate
Option B - ARM service connection (authMethod: arm)
Reuse an existing Azure Resource Manager service connection. Supports:
- Workload Identity Federation
- Service principal with client secret
- Service principal with certificate
- Managed identity
Step 2: Add the pipeline task
Download the template available and pick the job that suits your chosen authentication method. Create a pipeline with it.
Inline Exampels (ADO YAML Pipeline Jobs)
trigger: none

pool:
  vmImage: ubuntu-latest

jobs:

  # Option A: Observes service connection - Create under: Project Settings > Service connections > Observes Azure DevOps Scanner
  # Supports: PAT, service principal (secret or certificate)

  - job: ObservesSC_PAT
    steps:
      - task: observes@1
        displayName: 'Observes Scan - PAT'
        inputs:
          authMethod: observes
          observesServiceConnection: 'my-observes-sc-pat'
          organization: 'my-ado-org'
          jobId: '$(Build.BuildId)'
          # (Optional) projects: 'project1,project2'
          # (Optional) resultsDir: '$(Pipeline.Workspace)/observes-scan-results'
          # (Optional) topBranchesToScan: 5
          # (Optional) skipCommitterStats: true
          # (Optional) skipFeeds: true
          # (Optional) skipBuilds: true
          # (Optional) skipSast: true
          # (Optional) Identity resolution (requires laughing-lamp package)

  - job: ObservesCS_ServicePrincipal
    steps:
      - task: observes@1
        displayName: 'Observes Scan - Service Principal (secret or cert)'
        inputs:
          authMethod: observes
          observesServiceConnection: 'my-observes-sc-sp'
          organization: 'my-ado-org'
          jobId: '$(Build.BuildId)'
          # (Optional) same options as above

  # Option B: ARM service connection - Reuse an existing Azure Resource Manager service connection.
  # Supports: Workload Identity Federation, service principal (secret or cert), managed identity

  - job: ARM_WorkloadIdentityFederation
    steps:
      - task: observes@1
        displayName: 'Observes Scan - ARM (WIF, recommended)'
        inputs:
          authMethod: arm
          armServiceConnection: 'my-arm-sc-wif'
          organization: 'my-ado-org'
          jobId: '$(Build.BuildId)'
          # (Optional) same options as above

  - job: ARM_ServicePrincipalSecret
    steps:
      - task: observes@1
        displayName: 'Observes Scan - ARM (SP secret)'
        inputs:
          authMethod: arm
          armServiceConnection: 'my-arm-sc-sp-secret'
          organization: 'my-ado-org'
          jobId: '$(Build.BuildId)'

  - job: ARM_ServicePrincipalCert
    steps:
      - task: observes@1
        displayName: 'Observes Scan - ARM (SP certificate)'
        inputs:
          authMethod: arm
          armServiceConnection: 'my-arm-sc-sp-cert'
          organization: 'my-ado-org'
          jobId: '$(Build.BuildId)'

  - job: ARM_ManagedIdentity  # Note: managed identity only works on self-hosted agents running on Azure compute
    steps:
      - task: observes@1
        displayName: 'Observes Scan - ARM (Managed Identity)'
        inputs:
          authMethod: arm
          armServiceConnection: 'my-arm-sc-managed-identity'
          organization: 'my-ado-org'
          jobId: '$(Build.BuildId)'
Step 3: Upload results
Navigate to the Observes hub component in your ADO sidebar:
https://dev.azure.com/ORG/PROJECT/_apps/hub/Observesio.observes.observes-hub
Upload the scan results to complete onboarding.
Observes ADO hub component
Observes ADO Hub Component
Guide 2: Run Standalone
If the extension is not an option, you can run the scanner locally or in a pipeline and upload results to app.observes.io.
Step 1: Run the scanner
Download the standalone pipeline template:
Or install and run locally:
From the binary (recommended - no Python required). Download the latest release for your platform from GitHub Releases:
# Linux
curl -L https://github.com/observes-io/observes-scanner/releases/download/v1.2.0/observes-scanner-linux-1.2.0 -o scan
chmod +x scan
./scan -o <organization> -j <job-id> --auth-mode pat -p <pat-token>
# Windows (PowerShell)
Invoke-WebRequest -Uri https://github.com/observes-io/observes-scanner/releases/download/v1.2.0/observes-scanner-windows-1.2.0.exe -OutFile scan.exe
.\scan.exe -o <organization> -j <job-id> --auth-mode pat -p <pat-token>
From source
git clone https://github.com/observes-io/observes-scanner.git
cd observes-scanner
pip install -r requirements.txt
python scan.py -o <organization> -j <job-id> --auth-mode pat -p <pat-token>
See Authentication for all available --auth-mode options (pat, service principal, managed identity).
Step 2: Upload results
Navigate to app.observes.io and upload the scan results.
Curious but don't want to run a scan yet? Download the sample results from app.observes.io and explore the UI.
CLI Reference
-o, --organization           Azure DevOps organization name (required)
-j, --job-id                 Job ID for this scan (required)
    --auth-mode              One of: default, pat, service-principal, managed-identity
-p, --pat-token              PAT token (or set AZURE_DEVOPS_PAT env var)
-r, --results-dir            Directory to save scan results (default: current directory)
    --projects               Comma-separated list of project names or IDs to filter scan
    --top-branches-to-scan   Branches per repo: -1 all, 0 default only, N default + N top (default: 5)
    --skip-committer-stats   Skip committer stats for faster scans
    --skip-feeds             Skip artifact feeds scanning
    --skip-builds            Skip build data collection (resources and permissions only)
    --skip-sast              Skip SAST regex scans
    --resolve-identities     Enable identity resolution (requires laughing-lamp package)
See the CLI Reference Guide for example scenarios.
Required PAT Permissions
- Agent Pools (Read): Build agent pool data
- Analytics (Read): Language metrics and analytics
- Build (Read): Build definitions, pipeline runs, results
- Code (Read): Repositories, commits, branches, pull requests
- Graph (Read): Users, groups, service principals
- Project and Team (Read): Projects, teams, metadata
- Secure Files (Read): Secure files used in pipelines (contents not readable)
- Service Connections (Read): Service endpoints and connections
- Task Groups (Read): Shared task groups
- Variable Groups (Read): Shared variable groups (secure variable values not readable)
- Environment (Read & Manage): Required only for environment data
- Token Administrator (Read & Revoke): Required only for PAT token data
You can run the scanner without all permissions for partial results.
Navigating Results
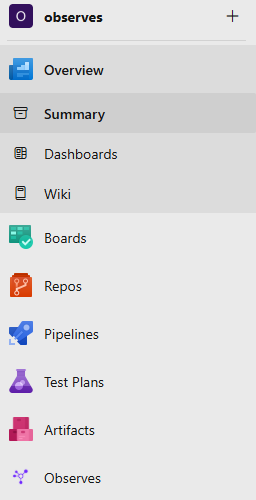
When you have at least one platform onboarded, the menu items will appear:
- Overview
- Resource Tracker
- Platform Management
Not sure what to look for? Use the base policy conditions from the built-in filters
- Is a resource protected by access conditions? Resource protected?
- Is a resource accessible by the expected pipelines? Resource overshared?
- Is a resource accessing the expected Logic Containers? Resource overprivileged?
- Is a resource cross-project? Shared across projects?
- Is a pipeline accessing resources? Permissioned pipeline?
- Is a pipeline permissioned into resources from different Logic Containers? Pipeline overpermissioned?
Filters for base policy set
Overview
The Overview page provides a high-level summary of onboarded platforms:
- Onboarded projects information
- Number of Pipeline Definitions and Pipeline Executions
- Number of CI/CD Resources (repositories, service connections, variable groups, secure files, pools)
- Language breakdown of repositories
Trackers
We have three trackers:
- Configuration Settings Tracker
- Resource & Pipeline Tracker
- Users & RBAC
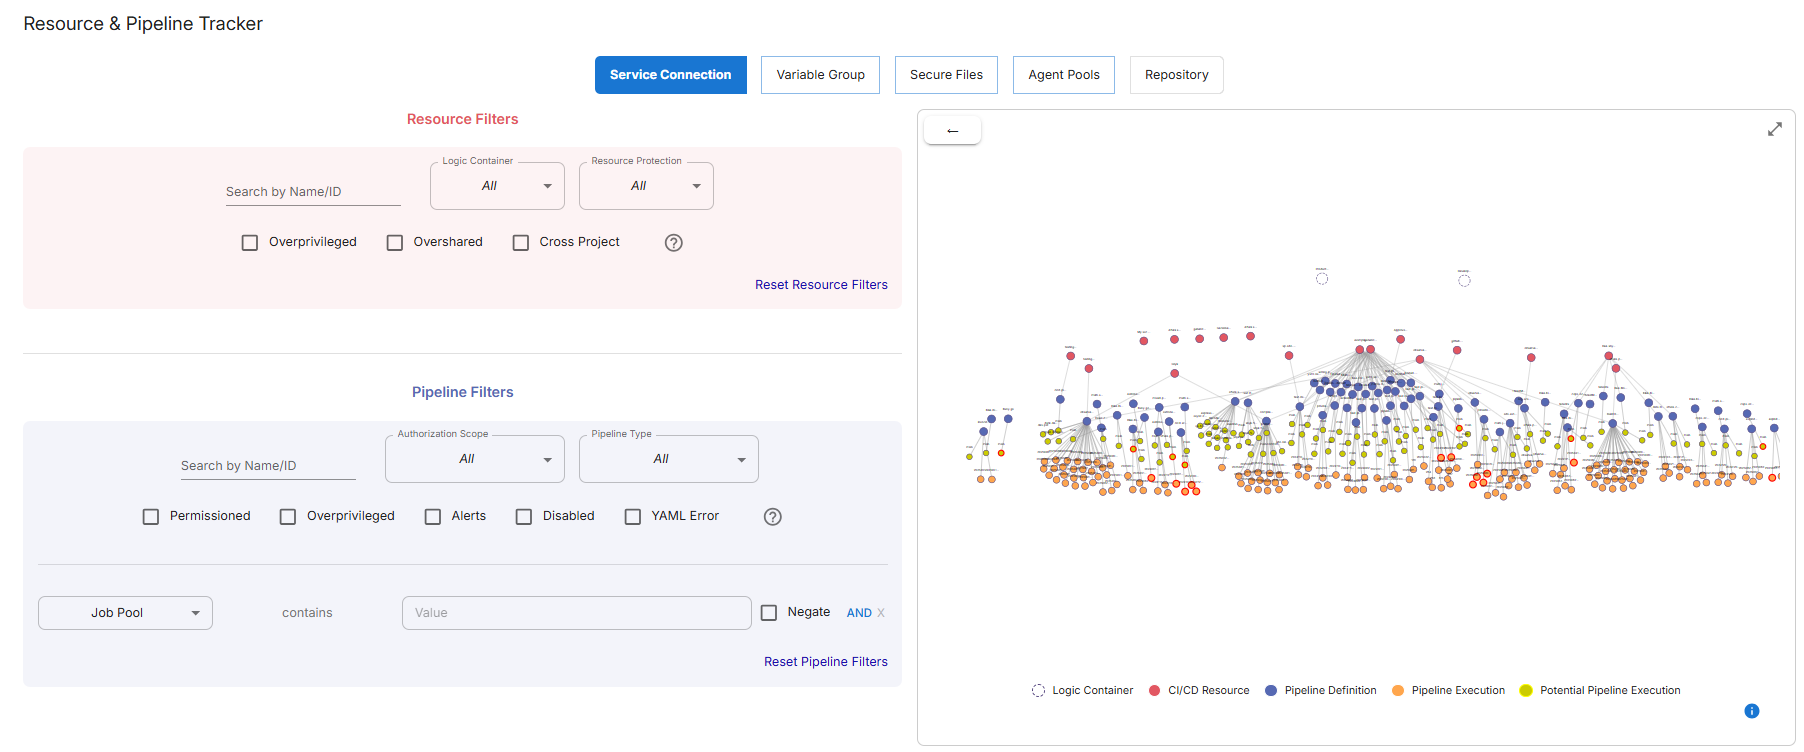
The Resource & Pipeline Tracker combines CI/CD Resources and Pipelines across onboarded platforms. It allows you to visualise, filter, and find relationships between resources and pipelines within a selected scope.
This screen will highlight action tracks. Find out what to do with Fast Track Adoption.
What Am I Seeing?
- White Nodes: Logic Containers
- Red Nodes: Discovered CI/CD resources
- Blue Nodes: Pipeline Definitions permissioned to access CI/CD Resources
- Yellow Nodes: Potential Pipeline Executions (imminent pipeline configurations)
- Orange Nodes: Pipeline Executions (instantiations of a pipeline)
Filtering Resources & Pipelines
Filters are available via the Natural Language filter bar. For example:
Show Service Connections and pipelines from all pipelines in my-org where the Service Connection name/ID contains
prod, and where the pipeline has alerts
You can:
- Choose what to show (a specific resource type or all resources)
- Scope by pipeline or project
- Add resource filter clauses (name/ID, logic container, protection state, overprivileged, overshared, cross-project, last used within X days)
- Add pipeline filter clauses (name/ID, specific pipelines, permissioned to filtered resource, has alerts, is disabled, has a YAML error)
Panel Filters
The collapsible filter panels expose additional advanced filters, including matching on repository name, stage, job, step type, step inputs, and more. Use the Reset button to clear a group of filters.
Resource & Pipeline Tracker
Saving and Reloading Filter Queries
Save a filter combination with the save button in the bottom action bar. Give it a name and optional description. Reload saved queries with the search button. Discard a loaded query with the X next to its name.
Platform Management
The Platform Management view is where most management takes place. Use Fast Track Adoption for guidance on:
- Overprivileged Pipelines
- Overprivileged Resources
- Overshared Resources
- Resource-based Policy
- Pipeline-based Policy
Settings
The Settings page lets you customise global configurations, such as the navbar location.